RC BAJA: STEERING AND SUSPENSION
TESTING
This section of the proposal will outline the various testing procedures that will be used to assess the RC car's overall performance and the functionality of its individual components. To evaluate the car's durability and resistance to an impact, a drop test from a height greater than 2 feet will be conducted and set as a requirement (Req. 1d-6). Next, steering tests are performed because the RC is meant to maneuver around obstacles during the competition. Finally, a turning radius test will help determine the turning radius of the RC, aiming to reach 2 feet but maintain it under 4 feet. To ensure consistent and reliable results, multiple trials of each test will be performed and recorded. The obstacle course, which is yet to be finalized, will be constructed as a collaborative job between the juniors. The following drop test, turning radius test, and steering test are done to evaluate the RC's deflection to not fail and performance in steering to avoiding obstacles. The methods used to predict the values are using geometry for steering and a deflection analysis of the suspension. The 2 foot drop test will test the RC's deflection and the steering angle test will determine the RC's maneuverability. In addition to the steering angle test, a turning radius test is conducted to test the turning radius .This will help determine if the RC will be able to avoid obstacles.
A significant risk during testing for the drop test was the RC breaking. The lower control arms were initially designed to have 3D printed ball joint end modeled after aluminum 6061 T6 ball joint ends that were purchased for the other control arms. The printed ball jointed were put in place at first because they provided more control than the aluminum ones, but they did not hold out enough during the 2 foot drop test. The RC was not able to withstand more than one drop with the 3d printed ball joint ends and they were rapidly replaced with the aluminum ball joint ends to continue testing in that moment. The RC did not continue to have problems and performed all the test without breaking. The team determined the tensile strength of the 3d printed plastic threads were not adequate for the 2 foot drop test.
Test #1
The first was test was done to cover the 2ft drop requirement. Although, the RC will not experience a drop from that high during the competition, but a 2ft drop impact will most likely be the most force the RC will experience besides during a sudden impact to a stop. The equipment needed for this test is a slow motion camera, writing utensil, blue tape, RC, paper, tape measurer, safety glasses, and a hanging scale. The RC risked breaking 3D printed ball joint ends but those were replaced with purchased aluminum ball joint ends and added more play to the steering. The change was necessary though because it improved the strength of the RC and resistance to sudden impact. The slow motion camera is used to capture the most deflection the RC experiences at each trial. The predicted value was 3.6 cm using conservation of energy equations and the highest deflection recorded was 3.795 cm average in the front view and 2.6 cm in the side view. A front view deflection video capture shows the RC bottoming out in Figure G3. The RC was dropped form the 2 foot blue tape marker on the wall while the phone records in slow motion facing the RC on the blue tape marker 4 feet away from the wall. All RC suspension components were completely assembled and ready to test in Figure G1. See Figure G2 for results. See Figure G3 for image of testing.

Figure G1- Image of testing set up where all the required materials are shown from the RC device to the measuring tool and writing utensils.

Figure G2- Results of front view and side view trails for 2 foot drop test. Trial 7 is the average.

Figure G3- Drop test trial of the RC bottoming out and using all of the clearance to deflect.
Test #2
The next test was done on the turning radius of the RC. Figure G1 shows the materials and things needed to perform the turning radius test The RC was initially required to have a turning radius of no more than 4 feet. The predicted value was based on the equation found on online involving the wheelbase and trackwidth of the RC. This equation was calculated by dividing the wheelbase of the RC by the tangent of the turning angle. The turning angle was calculated to be 51.95 degrees using geometry assuming the values of the wheelbase and trackwidth to be 11.5 inches and 18 inches. The turning angle for a full lock left turn would then be 25.975 degrees. The predicted value of 2 feet was derived this way, but the actual turning radius tested an average value of 4.31 feet. This is more than twice the predicted turning radius. The test was conducted simply placing the RC along an existing straight edge and keeping it perpendicular as much as possible. Then, driving full lock to the left and full throttle till it completes a half circle. The distance is then measured and recorded just like in Figure G3. There we no major risks when conducting the test. If the test required more trials with more load to the motor, it would have caused heating issues with the motor. A new motor that is brushless will do much better in managing heat.

Figure G4- Image of testing setup for the turning radius test in the Fluke lab in Hogue Hall. The following materials in the image are needed; straight edge, measuring tape, writing utensil, paper, blue tape, RC device, RC controller, and safety glasses.
Test #3
The final test was done to determine the steering angle of the RC. Figure G5 shows the materials and things needed to perform the steering angle test. Initially, the RC was required to meet a turning angle of 60 degrees and achieve a predicted value of 25.4 degrees. The RC demonstrated at most a turning angle of 29 degrees to the left and a turning angle of 35 degrees to the right. The total angle exceeded the requirement and reached 64 degrees. It was noted the right wheel was able to turn more than the left and that can be due to the wheel creating tilt or the RC needing alignment. The predicted value of 25.4 degrees was found using the 11.5 inches in wheelbase and turning radius of 4.31 feet from the previous test. The equation produced 12.7 degrees in one direction, which was multiplied by 2 to find the total predicted steering angle. The test was conducted by placing a protractor on the ground in the Fluke lab in Hogue Hall and taping it in place. The RC is placed on the pivot of the protractor and having the equilibrium set at the 90-degree mark. The RC is then turned to the left and measured for the range. The same is done when turned to the right. The right wheel is then tested under the same conditions and recorded in the table. Possibly having a new setup for steering will provide greater steering angle and more maneuverability although having a wide trackwidth. See Figure G6 for steering angle results.

Figure G5- Image of testing setup for the steering angle test in the Fluke lab in Hogue Hall. The following materials in the image are needed; protractor, writing utensil, paper, blue tape, RC device, RC controller, and safety glasses.
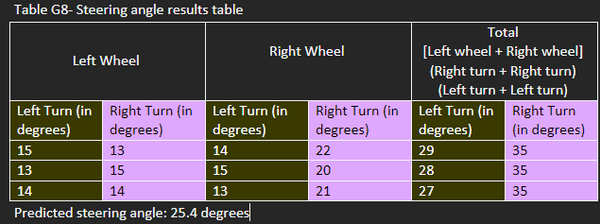
Figure G6- Steering angle results table
Test #1 videos
PART 1
In this video the RC is filmed in slow motion to capture the moment the RC experiences the most deflection.
PART 2
In this video the RC is filmed showing the trial of the RC bottoming out during the 2 foot drop test.
PART 3
In this video the RC is filmed showing the risks while dropping the RC unevenly. The RC is slamming the front end because the rear end landed first. This would affect the results of the test.
Test #2 videos
PART 1
In this video the RC is filmed demonstrating the wheels tilting, creating a slip angle and making the RC turn wide.
Test #3 videos
PART 1
This video demonstrates the RC's left wheel performing turns to the left and to the right at full lock. This is to show how the test was performed
PART 2
This video demonstrates the RC's right wheel performing turns to the left and to the right at full lock. This is to show how the test was performed